Index
1. What is an Area Chart?
2. When to use Area Chart?
3. Step By Step Guidance with DataInsider
WHAT IS A STACKED AREA CHART?
An Area chart combines the line charts (or bar charts) to displays how multiple groups’ numeric values change over the progression of the other variables. The difference between an area chart and a line chart is area chart has the shading between lines and a baseline.


WHEN TO USE AREA CHART?
In those following cases, a stacked area is recommended :
Breaking down values of the total value by groups
Comparison between groups
Total value is added up by groups' values.
STEP BY STEP GUIDANCE WITH DataInsider :
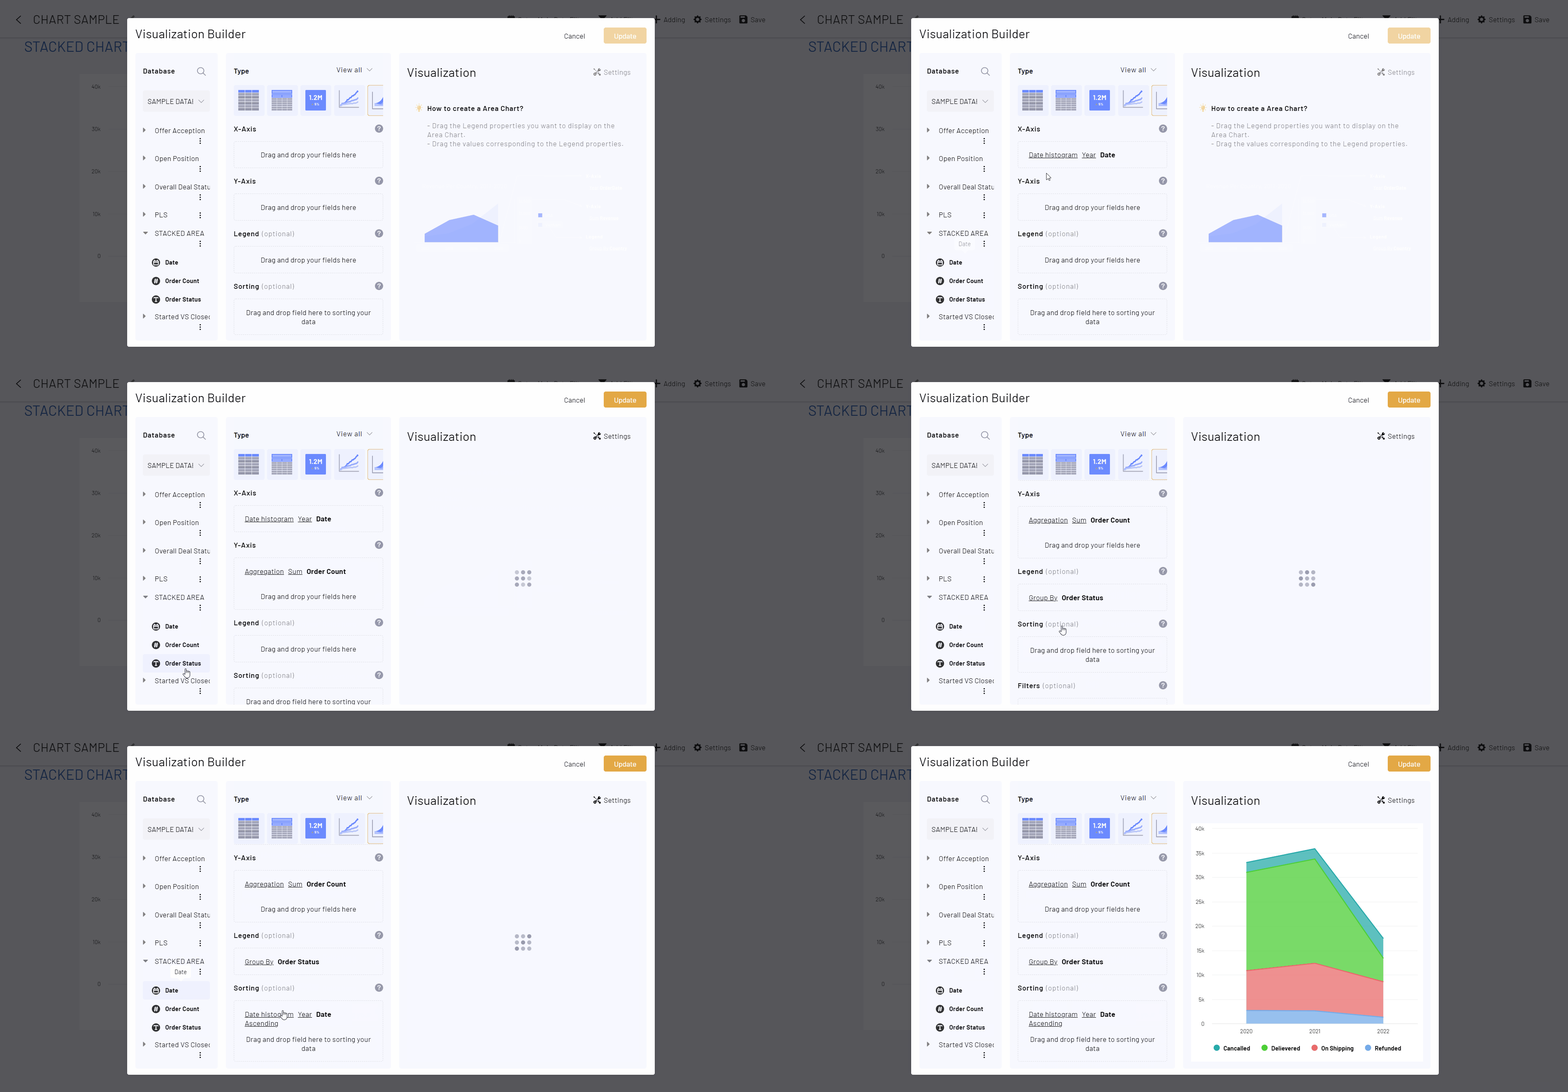
Desired chart: An area chart that summarizes Total Order Count shows how each Order Status contributes to the total count of products.
Step 1. Drag Year to X-Axis -
Step 2. Drag Order Count to Y-Axis
Step 3. Drag Order Status to Legend

Stacked Area Chart is used to summarizes total values while comparing and breaking down each series' values that contribute to the total.
Result:
