Index
1. What is a Funnel Chart?
2. When to use a Funnel Chart?
3. Step by step guidance with DataInsider
1. What is a Funnel Chart?
A Funnel Chart is a funnel-shaped chart in which the width of the head is broad and narrows to the neck. A Funnel chart demonstrates the value of multiple stages in a process.


2. When to use Funnel Chart?
Funnel Charts are used to track the participation of each stage in a business sales context or operational process. This type of visualization demonstrates how the starting whole breaks down into each followed stage.
Reading and analyzing a funnel chart helps a business understand the significance of each stage and detect the critical stage in which the crucial drop-off occurs to come up with a strategy to better users' experience and boost engagement.
3. Step By Step Guidance with DataInsider
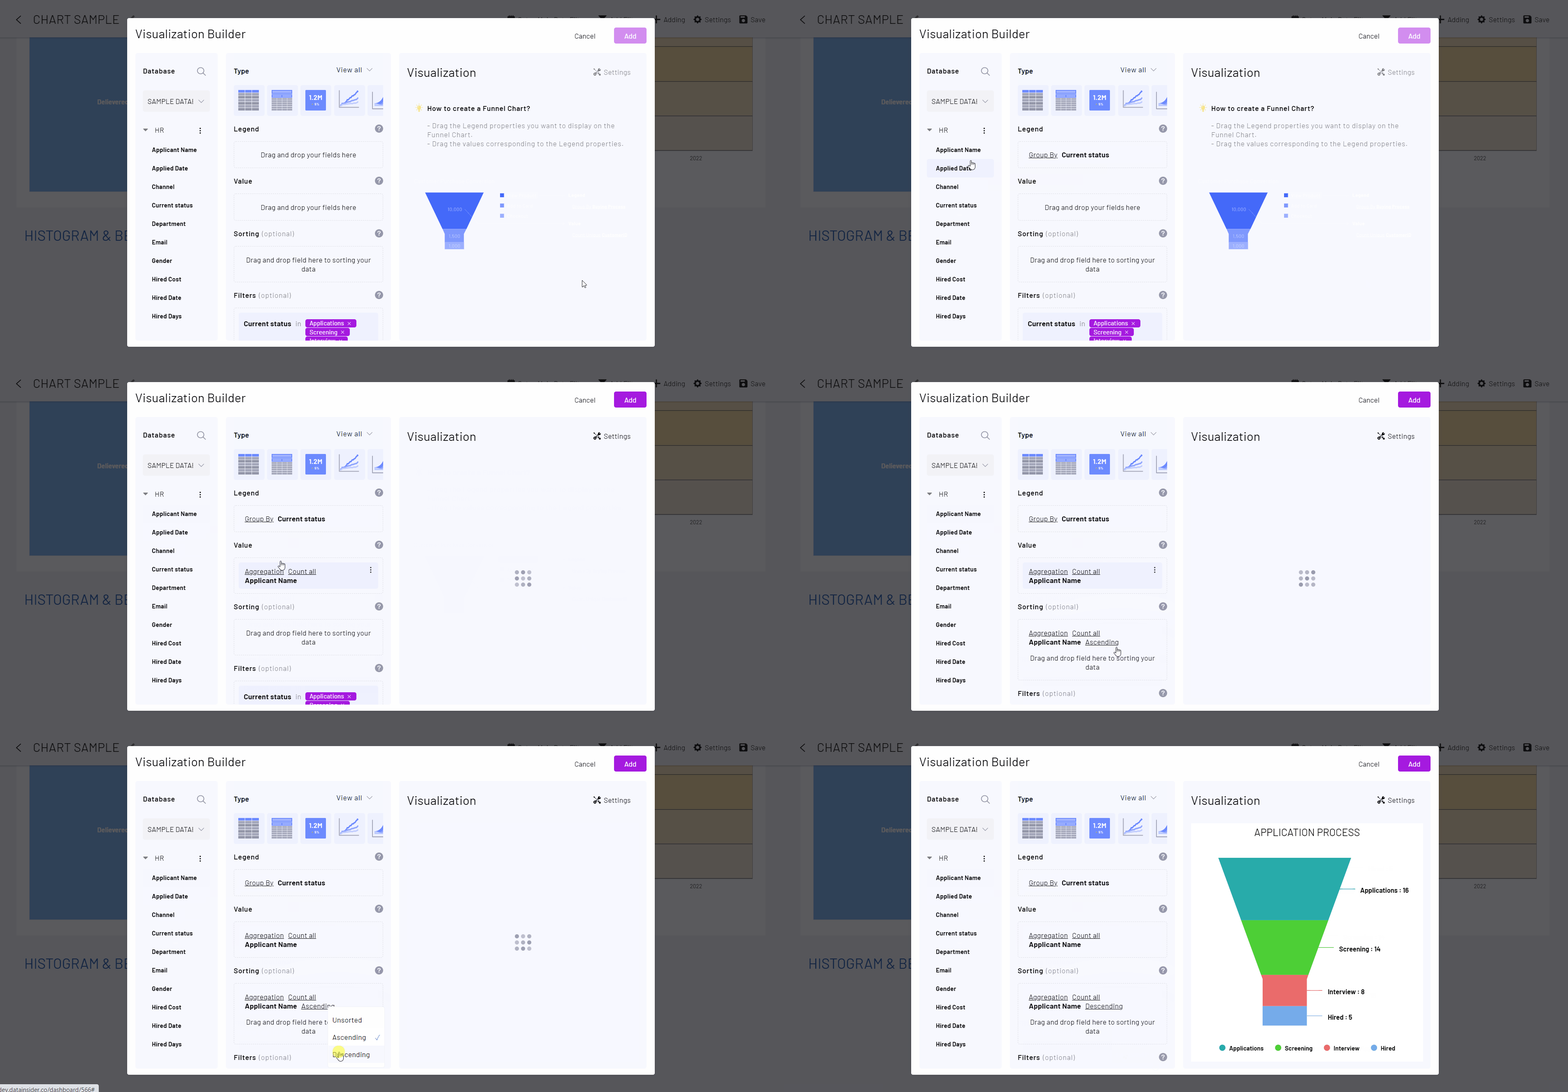
Desired Chart: A funnel chart representing the number of applicants throughout the application process.
Step 1. Drag Current Status to Legend
Step 2. Drag Applicant Name to Value
Step 3. Drag Applicant Name to Sorting -> Select Descending
