Index
1. What is a map in data visualization?
2. When to use map visualization?
3. Step by step guidance with DataInsider
WHAT IS A MAP IN DATA VISUALIZATION?
In Data Visualization, data is visualized in spatial relationships by being indicated on a geographical map. In other words, a Map is used to analyze and display geographically related data and present it in the form of maps.


WHEN TO USE MAP VISUALIZATION?
Map charts are ideal when in the following scenario:
You have geographical regions in your data set.
You want to position data in a geographical context.
You want to compare values and show categories across geographical regions.
STEP BY STEP GUIDANCE WITH Data Insider:
Step 1. Drag Location to to Location
Step 2. Drag Revenue to Value
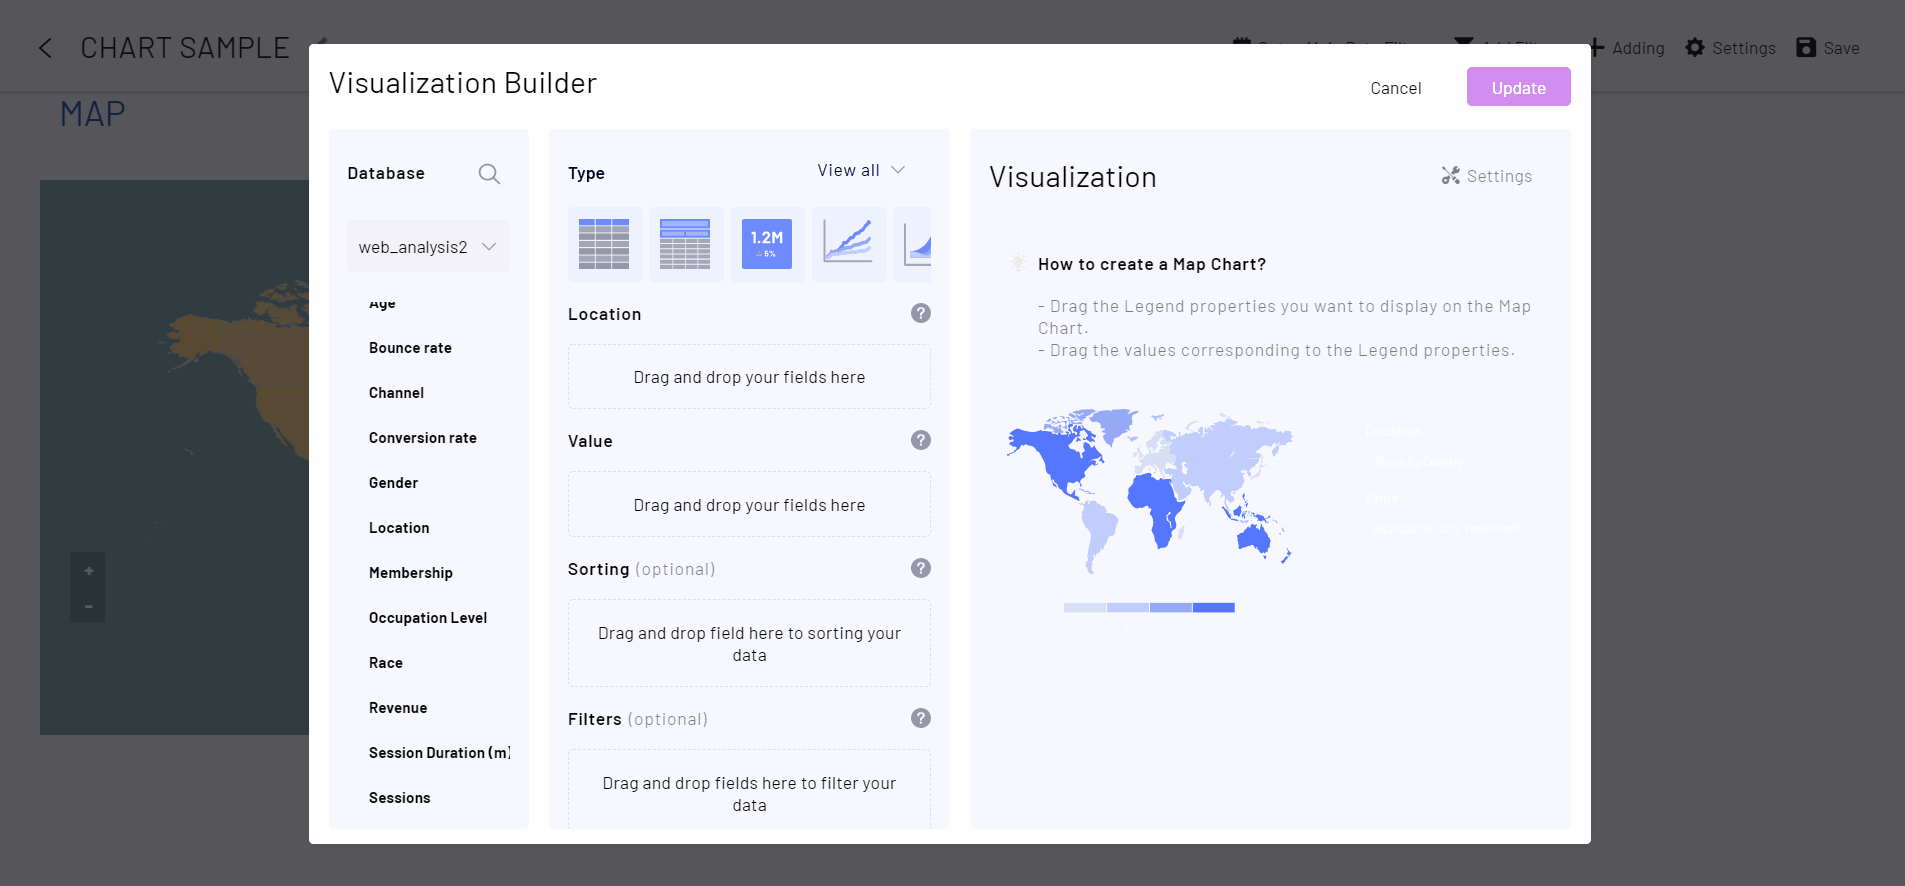
RESULT:
